The Climate Atlas of Canada was created by the Prairie Climate Centre at the University of Winnipeg. It is an innovative climate science and communications tool that allows users to visualize and interact with climate data as well as the human stories about climate change and climate action on the landscape from coast to coast to coast.
In the summer of 2019 the PCC released a major update to the portal. The data behind the Atlas now includes twice as many climate models, and we’ve made a lot of other changes to how things look and feel. Our goal is to continually improve the atlas’ usability and functionality to better support public education and applied decision-making.
If you were relying on the original version of the Atlas and need to refer to it, we have created an archive version that will remain available for a period of time. We will be clearly versioning all major releases of the Climate Atlas, which will allow users to track upgrades and associated data products.
Canadian Climate Data Portals Partnership
These upgrades have been made possible thanks to a climate data web portals initiative supported by Environment and Climate Change Canada. The Canadian Centre For Climate Services (CCCS) has coordinated the development of a suite of climate data portals, developed in Canada, that collaboratively share climate information with Canadians of all walks of life using a variety of tools and approaches.
The Climate Atlas is proud to make a contribution to this initiative. We take on the important task of providing tools and resources that are easy to understand to bring the global issue of climate change closer to home for Canadians.
The other portals offer more detailed and more varied sources of climate data for people who need more sophisticated tools:
High-resolution climate data to help decision makers build a more resilient Canada.
![]()
Advanced tools for academia, climate scenario developers, and other expert users.
Latest-generation climate model data
The new version of the atlas has been rebuilt using 24 global climate models (twice as many as in the first version). These models have been downscaled to a fine local scale by the Pacific Climate Impacts Consortium. Importantly, this 24-model ensemble was created using statistical techniques that preserve daily patterns in the global climate models, which is a big improvement over the approach used in the data behind version 1 of the Atlas.
See our Climate Atlas v2: Why have the Numbers Changed? page for a discussion of the differences between the two sets of climate model data, and the Data Sources and Methods page for a thorough overview of the climate data.
All-new “delta” maps
In the first version of the Atlas, all the maps displayed the average projected value for the selected climate variable. This is great for understanding what future conditions are projected to be like, but doesn’t get directly at how quickly the climate is changing.
The Atlas now offers the choice between average value maps and “change from the recent past” maps (called “delta” maps by scientists) that show the amount of change directly.
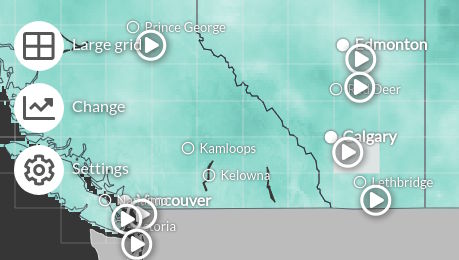
Average value
This map shows the average (mean) value of the selected climate variable across the selected 30-year time period, for a particular climate change scenario. This allows you to directly explore the projected climate of the recent past or one of two future time periods. For example, if you want to see how many +30 °C days various regions can expect in the future, this is the map you would use.
Change from recent past
This map shows the difference between the average value for the selected future 30-year time period and the 1976-2005 baseline period, for a particular climate change scenario. This allows you to explore how much the climate is projected to change compared to the recent past. For example, if you want to see how many more +30 °C days to expect under future conditions compared to “normal”, this is the map you would use.
More detailed local data
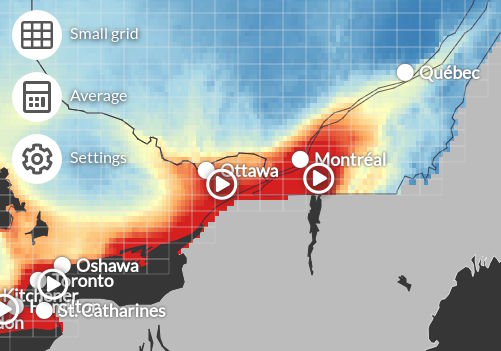
The Climate Atlas now provides climate data at a more detailed local scale than before. The Atlas now offers a choice between “large grids” (about 100km square in southern Canada) and “small grids” (about 30km x 60km).
This new level of detail means that Climate Atlas version 2 provides ten times as much data as our original release. Version 1 offered about 1600 clickable areas. In Version 2 you can now explore climate projections for more than 15,000 areas across the country. This is an exciting improvement, ensuring that Atlas users have the best available climate data at a resolution that is increasingly meaningful at the local level across Canada’s vast geography.
High-res maps of Canada
We’ve created downloadable, printable maps of Canada for every climate variable we offer, across three time periods (1976-2005, 2021-2050, and 2051-2080) and two future climate change scenarios (the “high carbon” future scientists call RCP8.5 and the “low carbon” future or RCP4.5).
Download these maps from the map sidebar or from our new downloads page.


.png)