Earth’s climate has changed many times and many ways. We know a lot about the natural causes and effects of ancient climate change, and this knowledge helps us state with confidence that modern climate change is a product of human activity.
But how can we know so much about the climate of the distant past?
Understanding Ancient Climate Change
Ancient people from all cultures took note of the weather and recorded it in many different ways, such as in their oral histories, diaries, literature, and works of art. And once weather instruments were invented we have been able to accurately measure and record observations in a more scientific way.
The longest record of temperature measurements made with thermometers comes from central England: it goes back to the year 1659. By the late 1800s thermometers were being used around the world, allowing for reliable estimates of the average temperature of the whole planet. This is why 1880 is often the first year in graphs showing how the world’s average temperature has changed. [1, 2]
But what about even further back?
There are a variety of ways to reconstruct what the climate was like in the distant past. For example, fossils can tell us what kind of temperatures prevailed millions of years ago, because we know that many plants and animals are only able to thrive within a narrow temperature range.
An especially important source of information about ancient climates comes from ice cores, such as those extracted from the Antarctic ice sheet. This mass of ice—over 4 km thick in some places—is the accumulation of snow that has fallen over hundreds of thousands of years. Within this ice are bubbles of air that were trapped when the snow originally fell, giving us a record of how the composition of gases in the atmosphere has changed over time. This is how we know that the amount of carbon dioxide currently in the atmosphere is much, much higher than it has been for at least 800,000 years (yes, the ice near the bottom of Antarctica is that old, and in places it is over 2 million years old) [3, 4].
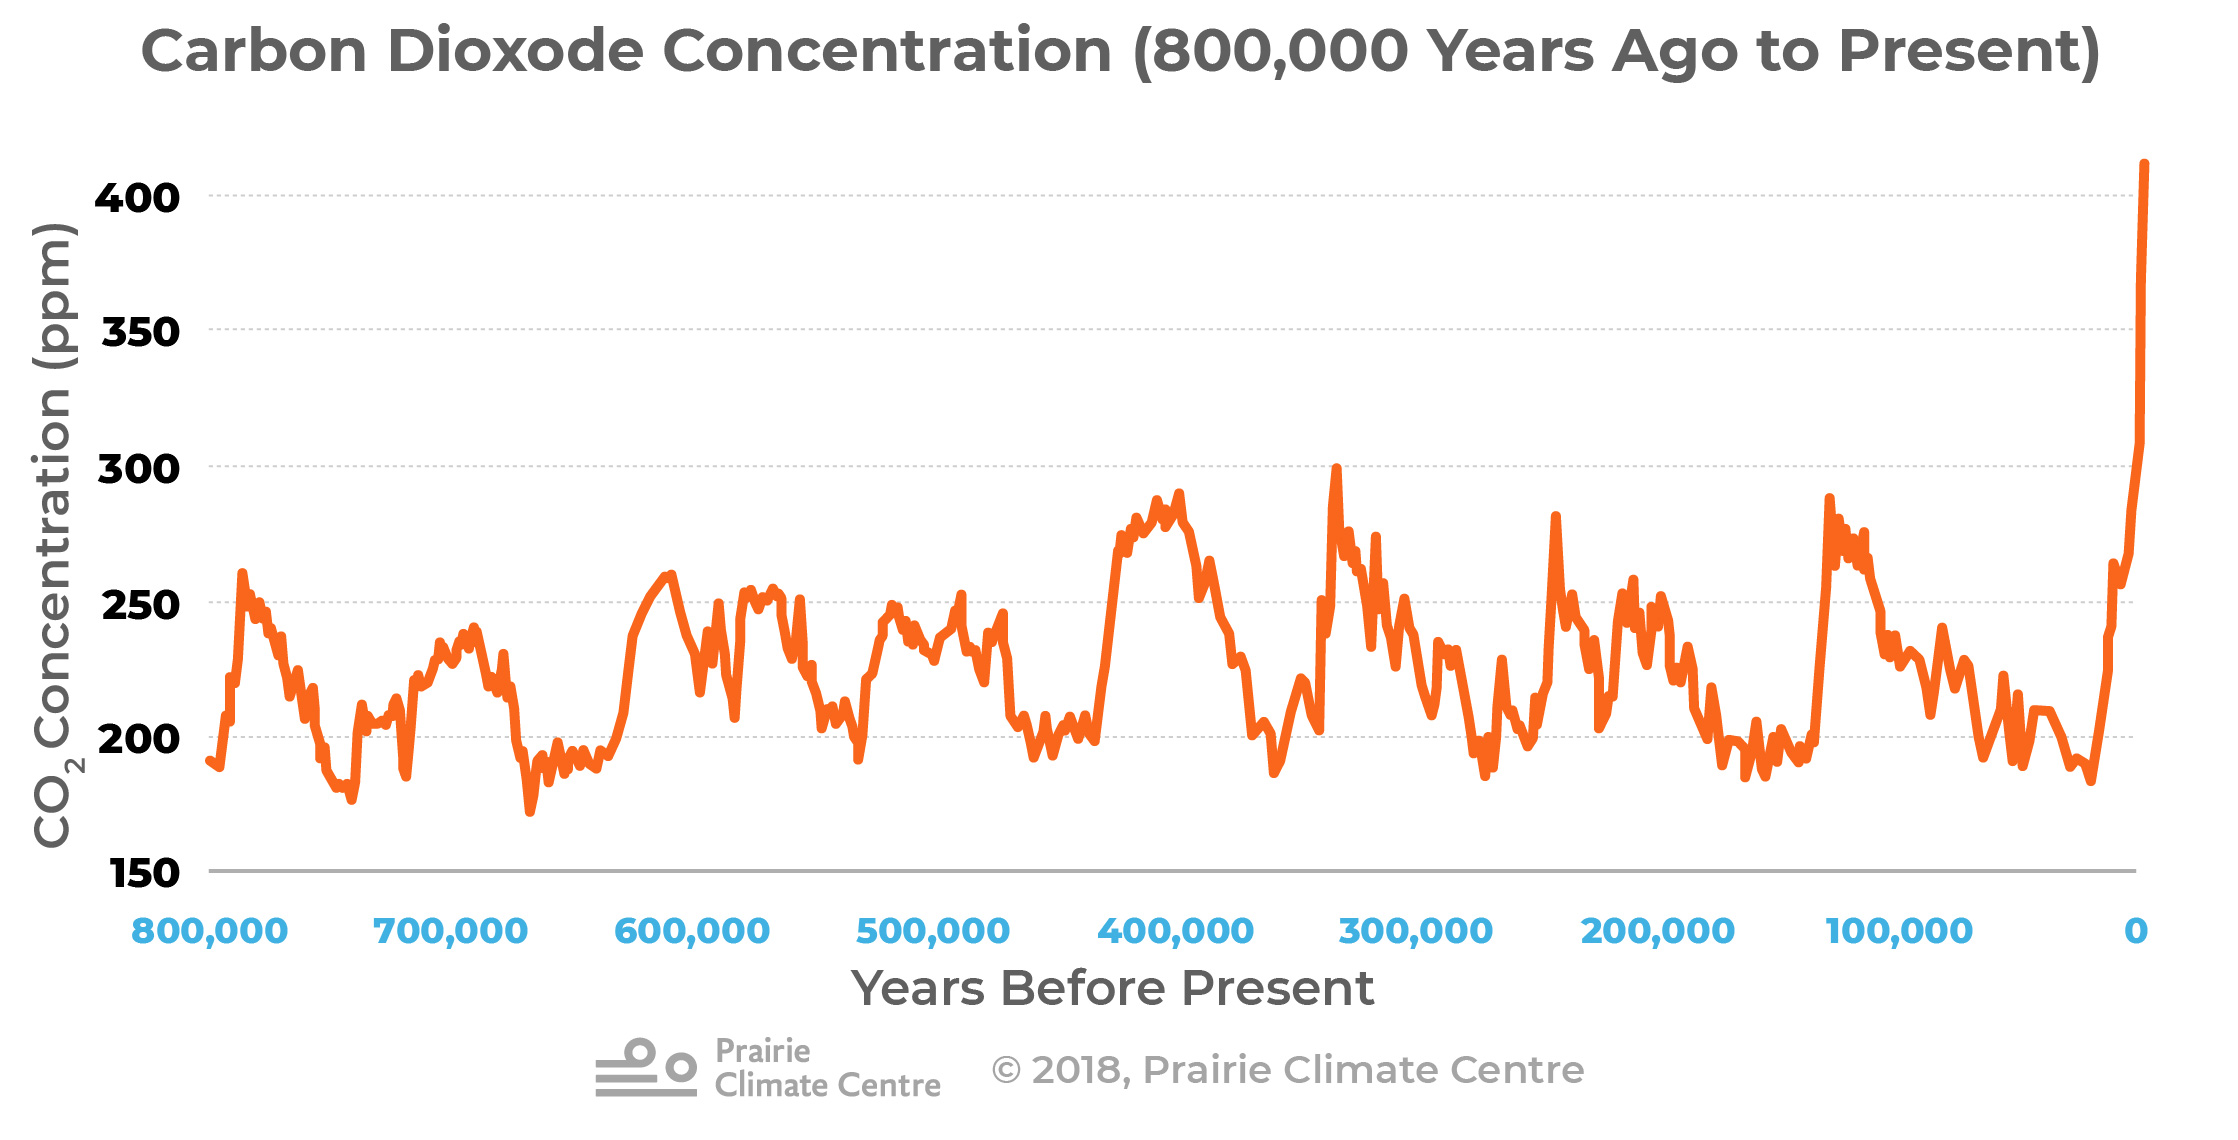
Carbon dioxide (CO2) record from the EPICA (European Project for Ice Coring in Antarctica) Dome C ice core covering 0 to 800 kyr BP. 75°06'S, 123°21'E, 3233m above sea level.[15]
Important climate data can also be extracted from the ice itself. Very small variations in the hydrogen and oxygen atoms that make up ice reveal what the temperature was when the snow fell.
Read more: Reconstructing the temperature record from ice cores
Not all atoms of the same element are created equal. Take hydrogen: almost all hydrogen atoms come with one proton and one electron. However, a small proportion of hydrogen atoms have a bonus neutron. Scientists call this variant deuterium. Deuterium is therefore much heavier than regular hydrogen. Similarly, some oxygen atoms have two bonus neutrons, making them heavier as well. Scientists call these lighter and heavier variants isotopes.
sWhen water molecules that contain one or more of the heavier isotopes of hydrogen and/or oxygen are therefore heavier than water that only contains the light isotopes. These heavier water molecules require slightly more energy to evaporate. This means that when the climate is cool, the proportion of heavier water that gets evaporated into the atmosphere is lower than when the climate is warm. If the climate stays cool for long enough, Earth’s water bodies become enriched with heavy isotopes, as the light water is carried away to fall as precipitation somewhere else. Consequently, the snow that falls in places like Antarctica is depleted in heavy isotopes. The ratio of heavy to light isotopes in ice core samples is an exceptionally good indicator of past temperatures.
Using this evidence, scientists have shown that the world has warmed up and cooled down many times over the last 800,000 years: the so-called ice ages have come and gone many times. Evidence of this ancient climate history can be found around the world. For example, sediment cores from the bottom of the ocean also tell the same story.
Overall, the ice and sediment cores show us that there is a very, very strong relationship between the amount of carbon dioxide in the atmosphere and the global temperature [5]. When the world was warm, the concentration of carbon dioxide was high; when the world was cold, the concentration of carbon dioxide was low. The carbon dioxide concentration in the atmosphere today is over 40% higher than it has been at any time in the past 800,000 years—and it’s rising fast [4]. Based on everything we know about these past climate changes, we should expect the world to be getting warmer. And it is. [2]
Causes of Past Changes
An abundance of evidence tells us that Earth has undergone many natural climate changes.
For example, about 20,000 years ago sheets of ice kilometres thick covered almost all of Canada, and ocean levels were more than 100 metres lower than they are now [6]. The climate gradually warmed, and these ice sheets all but disappeared. Over the last 10,000 years, the Earth has experienced relatively stable average global temperatures [7]—that is, until humans started to meddle with the chemistry of the atmosphere.
But how does Earth’s climate change without human influence?
The Sun
The sun is Earth’s only source of heat and light, so it’s natural to assume that changes in the global temperature must be related to changes in the sun’s output.
For centuries now, scientists have known that the sun’s output (irradiance) varies over time. Periods of slightly higher solar output are associated with the appearance of sunspots, and astronomers have been recording the number of sunspots since the 1600s. The so-called “Little Ice Age” that affected parts of Europe and North America for several centuries ending in the 1800s is thought to have been caused (at least in part) by a decrease in solar output. Why don’t we think that some sort of similar change in the other direction is having a warming effect now?
Well, there simply isn’t a trend in solar output that explains the rise in the global temperature. In fact, we are at the low end of the most recent 11-year solar cycle, so the past decade of warming has taken place despite low output from the sun.
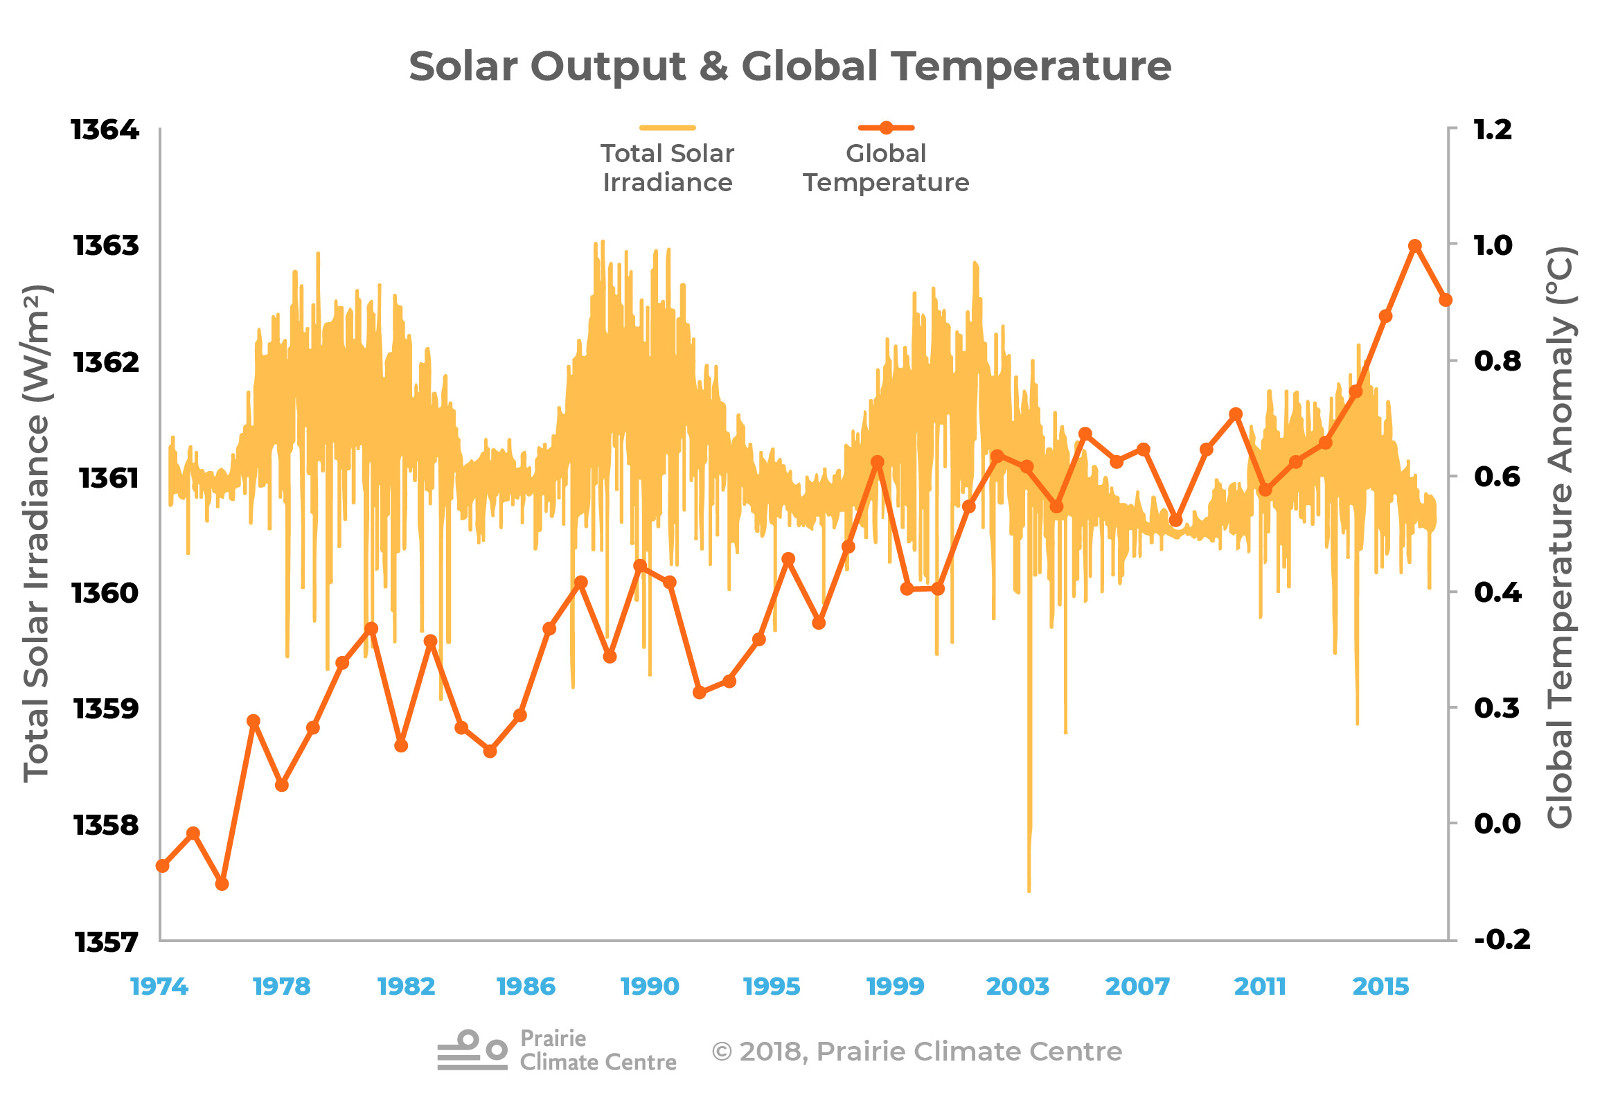
Caption: The warming observed around the world compared to the 11-year solar cycle. This graph shows the Total Solar Irradiance (TSI; W/m2) [8] and global land-ocean temperature anomalies (°C; relative to 1951-1980) [9]. The TSI satellite record extends back to 1974. There is no correlation between rising global temperatures and solar variation.
Milanković cycles
Serbian scientist Milutin Milanković is credited with showing that very slow changes in Earth’s position relative to the sun have an impact on climate. The shape of Earth’s orbit around the sun, the angle of its tilt, and a “wobble” in its rotation are now known to have initiated the ice ages [10].
How do we know that these cycles don’t explain modern global warming? First, these natural planetary cycles change Earth’s climate over tens of thousands of years, and current global warming is happening much more quickly, over just decades. The speed of current climate change cannot be explained by these very slow Milanković cycles. We also know that the current state of the Milanković cycles was likely causing global cooling before human greenhouse gas emissions reversed this trend [7, 10].
Read more: Volcanoes and smoke
The amount of sunlight that reaches Earth’s surface decreases if the atmosphere becomes smoky or dusty. Large volcanic eruptions release millions of metric tons of gas, ash and reflective aerosols into the atmosphere, blocking out the sun [13].
The massive volcanic eruption of Mount Pinatubo in 1991, for instance, singlehandedly reduced the amount of sunlight reaching the surface of the Earth by 10%, and the average global temperature dropped by about 0.6 °C [14]. As is typical for these eruptions, the effect only lasted about two years.
Forest fires also send smoke and soot into the atmosphere that temporarily blocks out some sunlight. The effects of forest fires can be dramatic, but also tend to be short-lived and regional.
Feedback loops
The large climate changes of the past were often caused by relatively small factors whose effects were amplified over time. Small shifts can trigger self-reinforcing cycles that, over many thousands of years, become major climate changes. The Milanković cycles are probably the best example of how small changes become amplified over time.
When the Milanković cycles caused summers in the Northern Hemisphere to become colder, ice sheets were able to grow year after year. The reflection of sunlight from these ice sheets caused the climate to get even colder, accelerating the growth of the ice sheets [11]. Other feedback loops were then triggered as the global temperature fell. Because colder oceans can store more carbon dioxide than warm oceans, the amount of carbon dioxide in the atmosphere was reduced and the greenhouse effect became weaker, further cooling the planet. Scientists have identified many feedbacks of this sort, whereby one change causes a domino effect of reinforcing changes.
This also works in the opposite direction: as the planet warms up, the oceans release more carbon dioxide to the atmosphere, making the climate heat up even more, and so on. This is one way in which very small changes can become amplified over time.
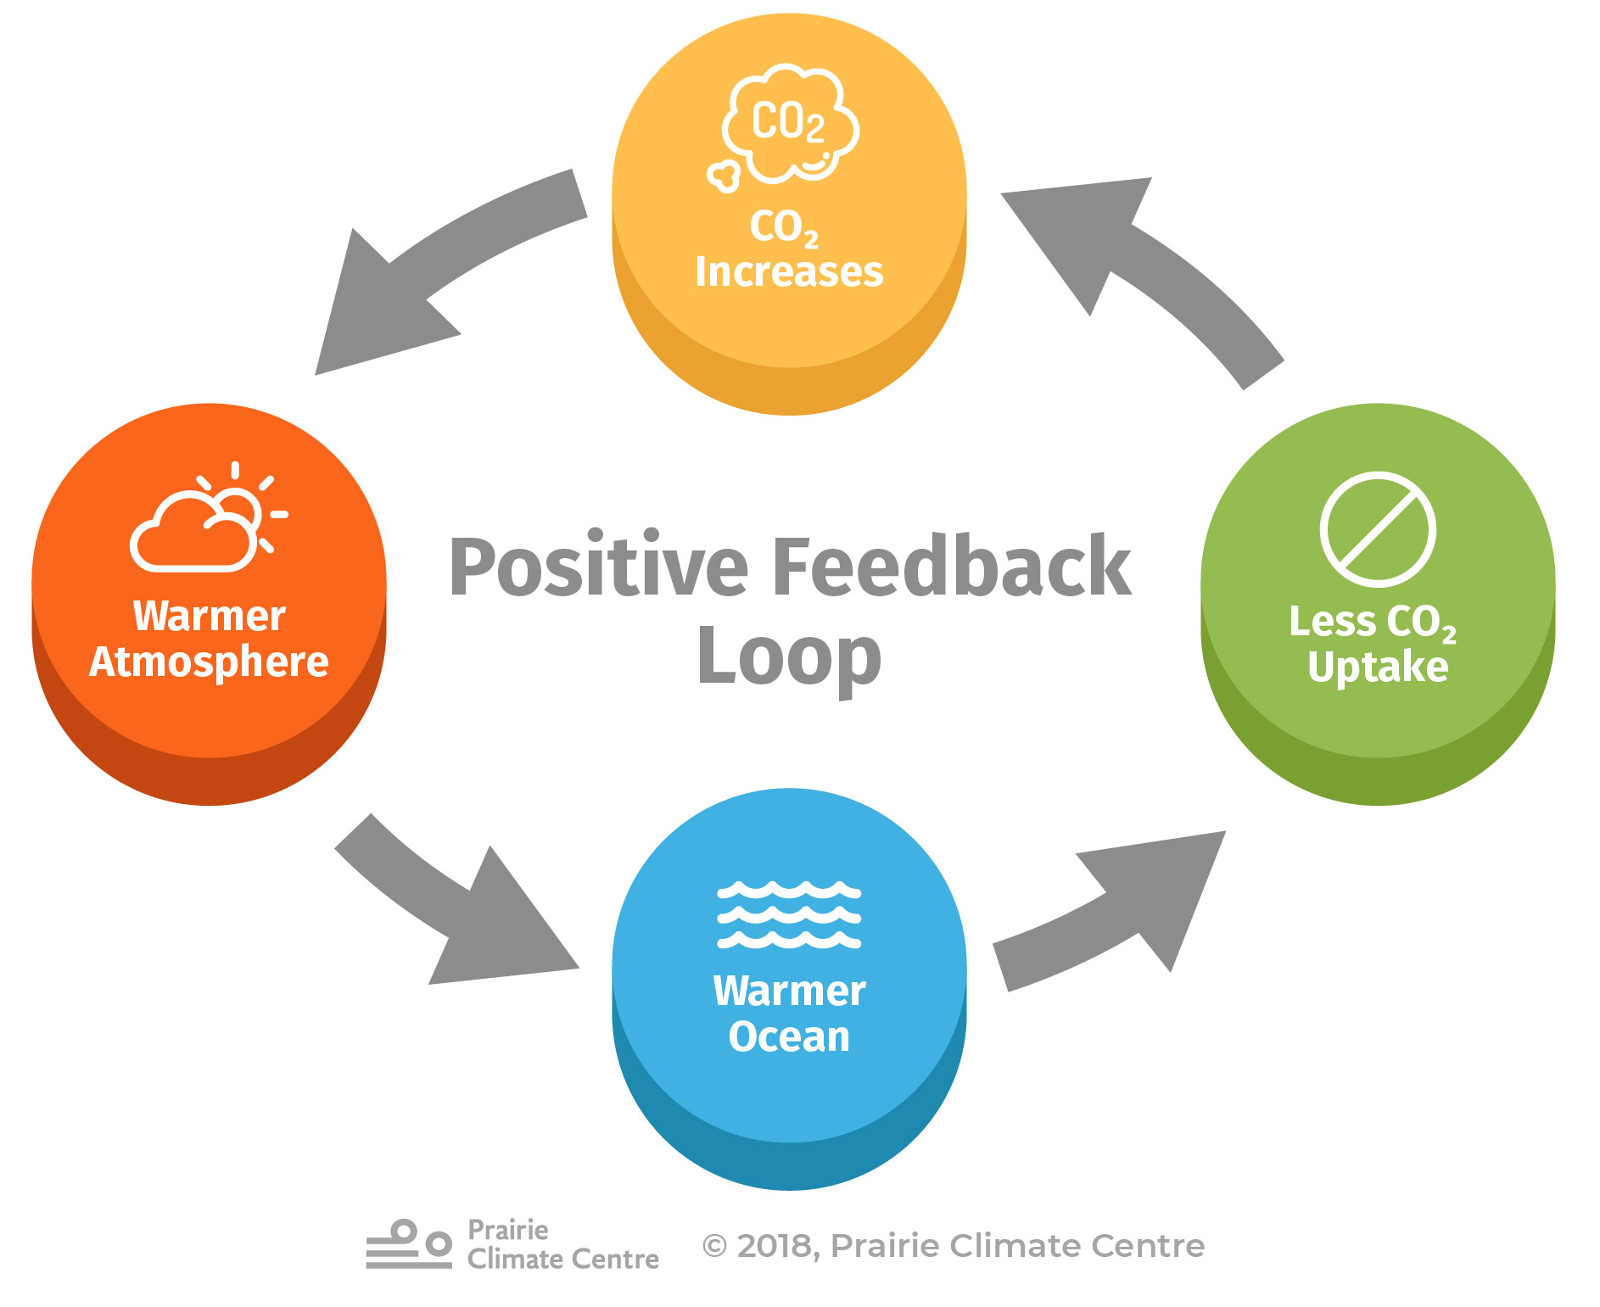
Feedback loop: warming leads to more CO2, which causes more warming
Modern Global Warming
Humans are now the primary driver of climate change [12]. The burning of fossil fuels has dramatically intensified the greenhouse effect, eclipsing the effects of natural changes in solar output and orbital cycles that were the cause of past climate changes.
Fortunately, we can take steps to reduce greenhouse emissions and mitigate the severity of human-caused climate change. See our “Take Action” section for stories and ideas about how Canadians can take meaningful action on climate change.
References
- Met Office. Hadley Centre Central England Temperature (HadCET) dataset
- Hartmann, D.L. et al. “Observations: Atmosphere and Surface.” In: Climate Change 2013: The Physical Science Basis
- The Epica glaciology project.
- Lüthi et al. “High-resolution carbon dioxide concentration record 650,000–800,000 years before present.” Nature 453: 379-382.
- NASA. Goddard Institute for Space Studies. Science Briefs. “CO2: The Thermostat that Controls Earth's Temperature”
- United States Geologic Survey. “Glaciers and Sea Level”
- Marcott, Shaun A., Jeremy D. Shakun, Peter U. Clark, and Alan C. Mix. “A Reconstruction of Regional and Global Temperature for the Past 11,300 Years” Science 339 (8 Mar 2013): 1198-1201.
- Max Planck Institute for Solar System Research. “The Sun and the Earth’s Climate”
- NASA. Goddard Institute for Space Studies. “GISS Surface Temperature Analysis”
- NASA Earth Observatory. “Milutin Milankovitch: Orbital Variations"
- Science Daily. “Why an ice age occurs every 100,000 years: Climate and feedback effects explained”
- Prairie Climate Centre. “It Ain’t Natural: How we Know Humans are Causing Climate Change”
- United States Geologic Survey. “Volcanoes can Affect Earth’s Climate”
- NASA Earth Observatory. “Global Effects of Mount Pinatubo”
- Lüthi, D., M. Le Floch, B. Bereiter, T. Blunier, J.-M. Barnola, U. Siegenthaler, D. Raynaud, J. Jouzel, H. Fischer, K. Kawamura, and T.F. Stocker. 2008. High-resolution carbon dioxide concentration record 650,000-800,000 years before present. Nature, Vol. 453, pp. 379-382, 15 May 2008. doi:10.1038/nature06949
Further Reading
- Prairie Climate Centre. “Will climate history repeat itself? Lessons from past global warming events”
Past climate records and reconstructions
- Pennsylvania State University. “Temperature: Instrumental Records”
- Real Climate. “Paleoclimate: The End of the Holocene”
- XKCD. “A Timeline of the Earth’s Average Temperature” [comic]
- United States of America. National Centres for Environmental Information. “How Do Scientists Study Ancient Climates?”
- British Antarctic Survey. “Ice Cores and Climate Change"
- National Oceanic and Atmospheric Administration (NOAA). “What's the hottest Earth's ever been?"
Natural forces
- IPCC. “Anthropogenic and Natural Radiative Forcing.” In Climate Change 2013: The Physical Science Basis.
- COST (European Cooperation in Science and Technology). “A changing sun, a changing climate?”
- Union of Concerned Scientists. “How Does the Sun Affect our Climate?”
- Skeptical Science. “Milankovitch Cycles”
Feedback loops
- Phys.org. “Ice ages only thanks to feedback”
- Explaining Climate Change: “Lesson 7: Feedback Loops”
- University of California San Diego. “Climate Change: 6.2 The physical carbon pump”
- Skeptical Science. “Climate Sensitivity: Feedbacks, anyone?”
Recommended Article Citation
Climate Atlas of Canada. (n.d.) Why Climates Change. Prairie Climate Centre. https://climateatlas.ca/why-climates-change


.png)