The Climate Atlas allow you to explore how climate change is likely to impact Canada’s urban centres.
Hotter temperatures can magnify pollution problems and cause health problems, and changes in precipitation and freeze-thaw patterns can accelerate damage to critical infrastructure.
Understanding the magnitude of these changes and risks allows citizens, politicians, and planners to take meaningful action to mitigate and adapt. These maps describe some of the key climate impacts facing Canada’s cities:
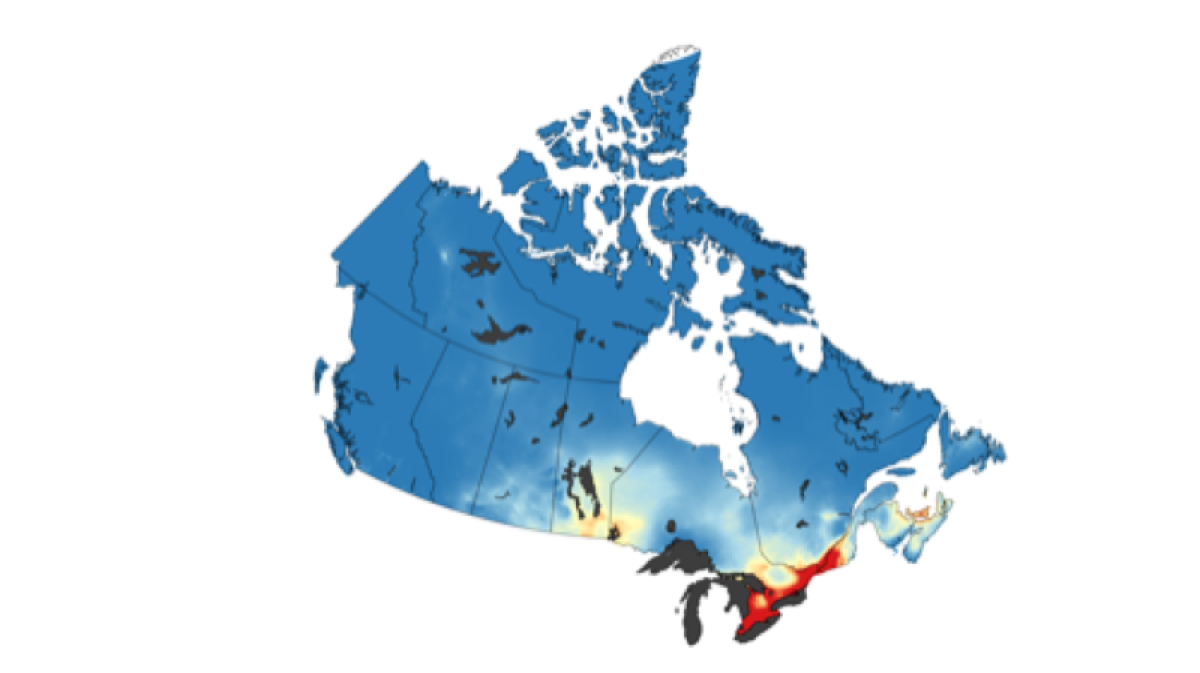
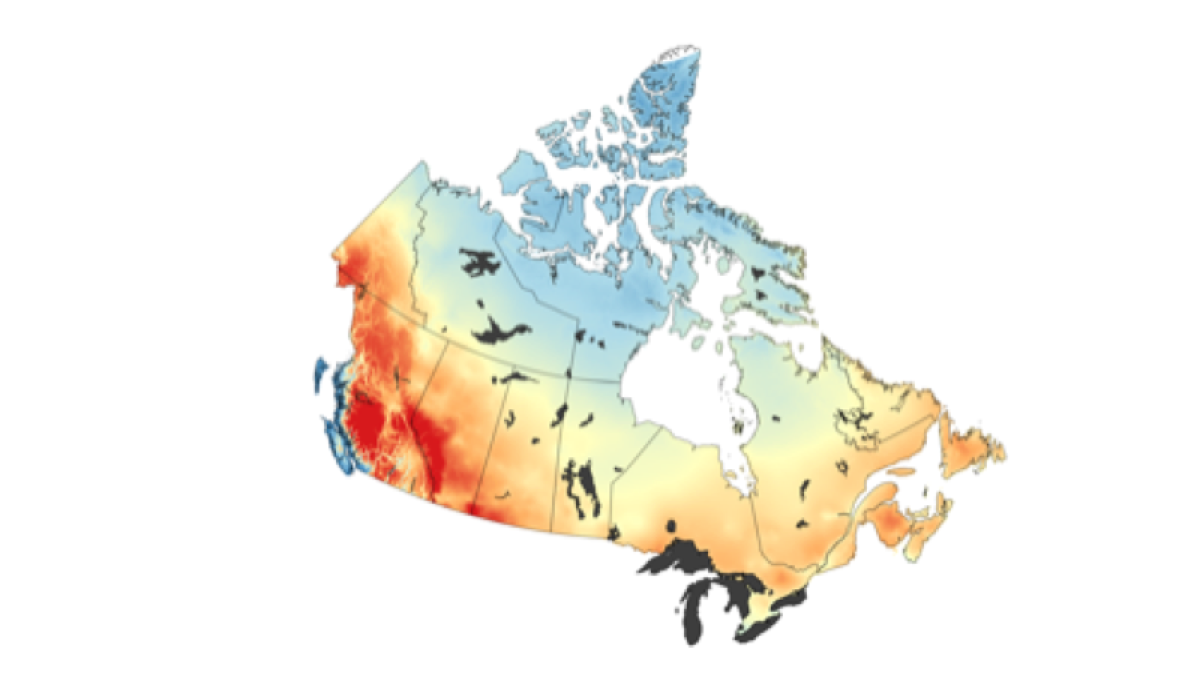
Very hot days
Number of days +30 °C or warmer
High temperatures are important. They determine if plants and animals can thrive, they limit or enable outdoor activities, define how we design our buildings and vehicles, and shape our transportation and energy use. It is useful to know how high summer temperatures are likely to become in the future, to make sure that our cooling and air-conditioning systems can reliably deal with these extremes.
Tropical Nights
Number of nights +20 °C or warmer
High night time temperatures are another indicator of persistent heat. Hot summer days are physiologically stressful, especially if overnight temperatures do not provide cooling relief. It is important to also take the Urban Heat Island Effect into account when considering the effects of rising temperatures in urban environments.
Heavy Precipitation Days
Number of days with more than 10mm (or 20mm) of precipitation
Heavy rainfall events can create many challenges, including backed up storm drains and flash flooding. Heavy snowfall events can disrupt transportation, and very heavy snowfall can even damage buildings. It’s essential to understand possible changes in the amount and the seasonal distribution of precipitation to properly plan for the new climate reality.
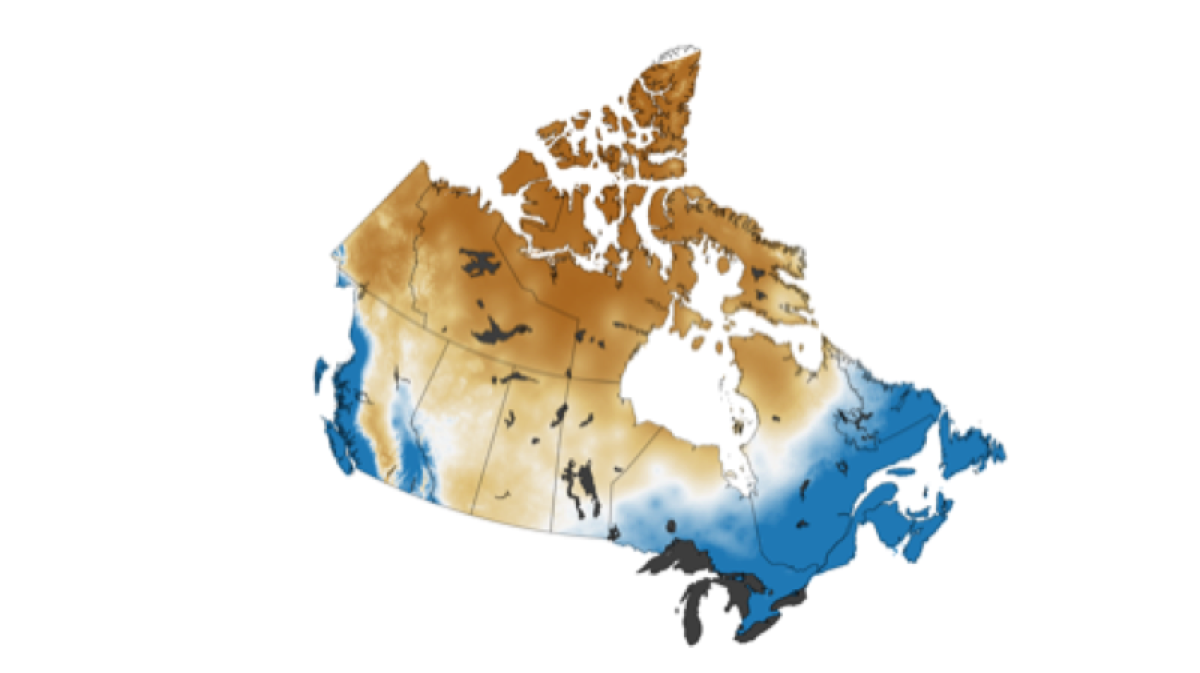
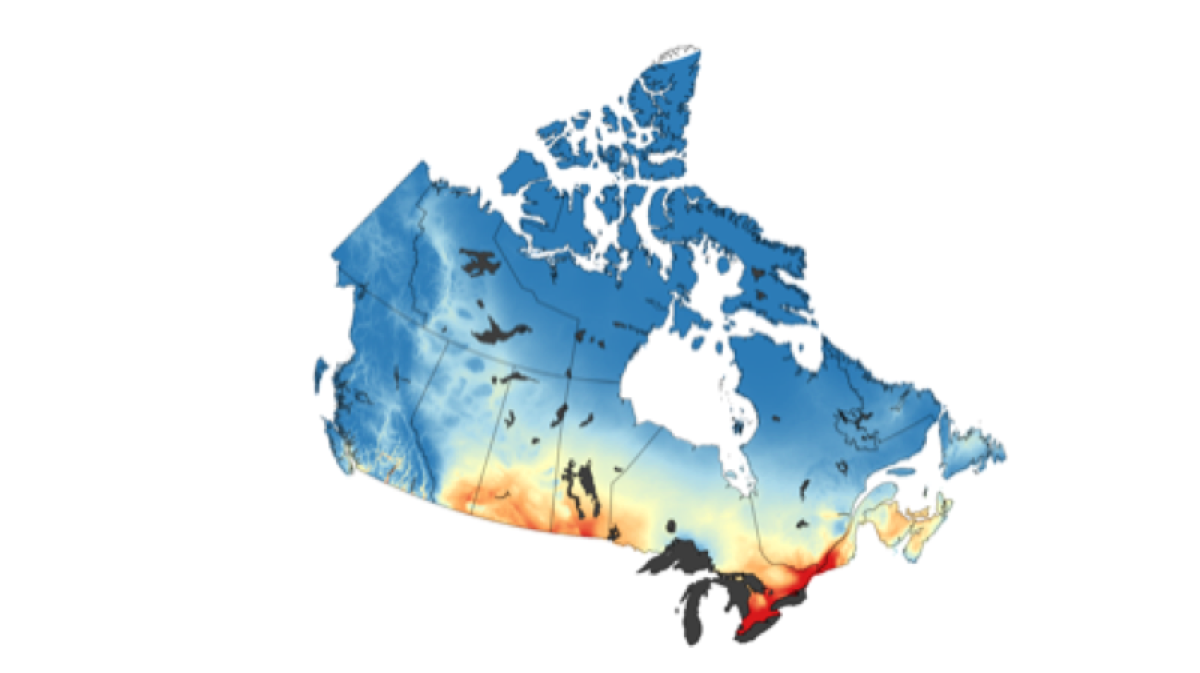
Freeze-thaw Cycles
Number of times the temperature crosses freezing
Freeze-thaw cycles can have major impacts on infrastructure. The freezing, melting and re-freezing of water can over time cause significant damage to roadways, sidewalks, and other outdoor structures. Potholes that form during the spring, or during mid-winter melts, are good examples of the damage caused by this process. Understanding possible changes in these cycles will help cities make key decisions about the design and maintenance of infrastructure.
Cooling Degree Days
Accumulated temperature over 18 °C
Cooling Degree Days are often used to estimate how much air-conditioning is required in a year. If a location shows an increase in projected Cooling Degree Days values, this implies that it will experience hotter or longer summers. This is a helpful measurement for planners and engineers, who use Degree Days in design work, but also for everyday citizens who can use it to estimate and understand the coming changes in our everyday experience of the seasons.
Recommended Article Citation
Climate Atlas of Canada. (n.d.) Climate Maps for Cities. Prairie Climate Centre. https://climateatlas.ca/climate-maps-cities


.png)